Stock Analysis Program
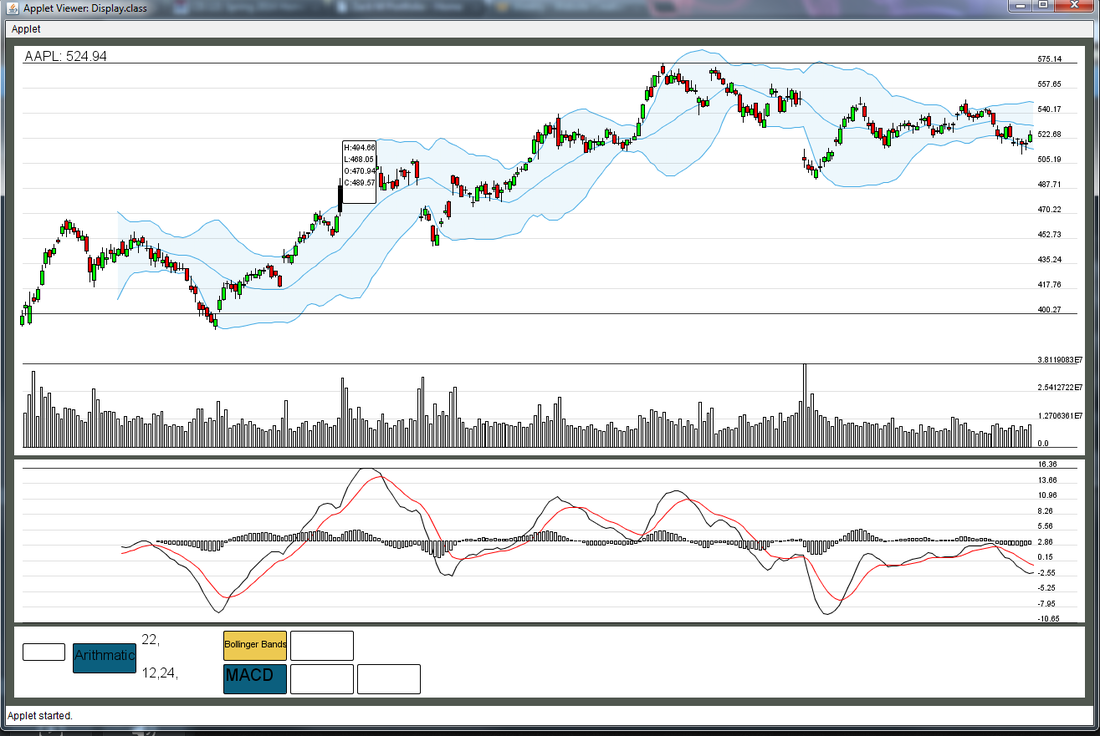
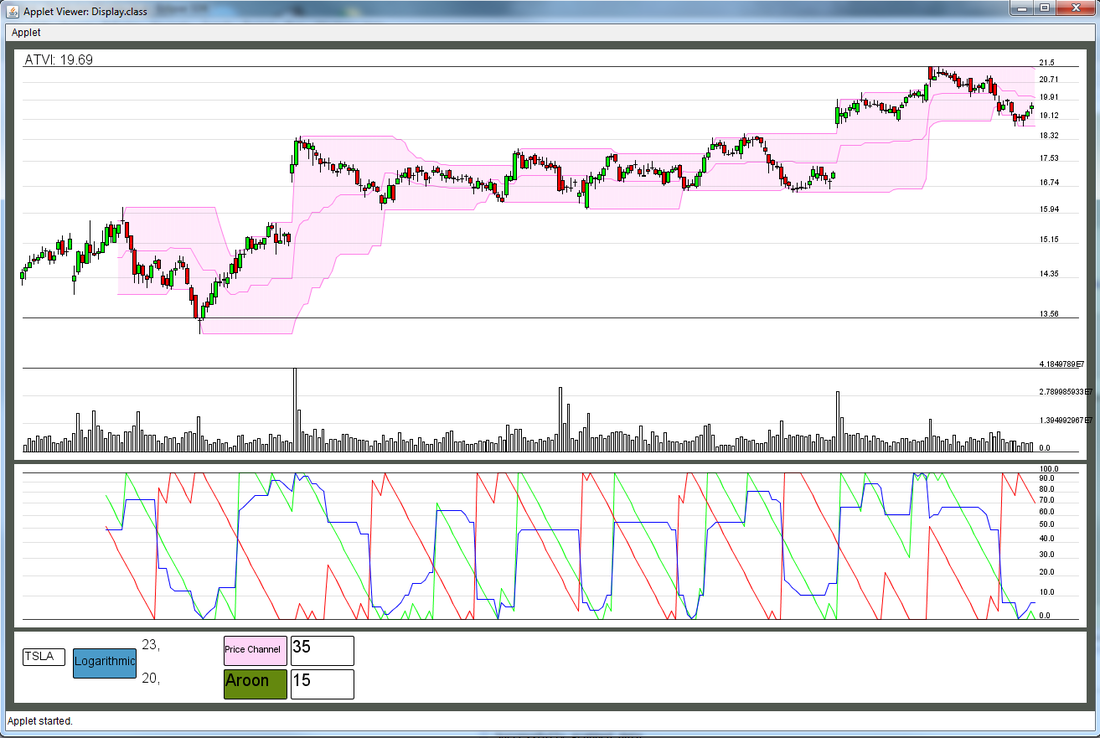
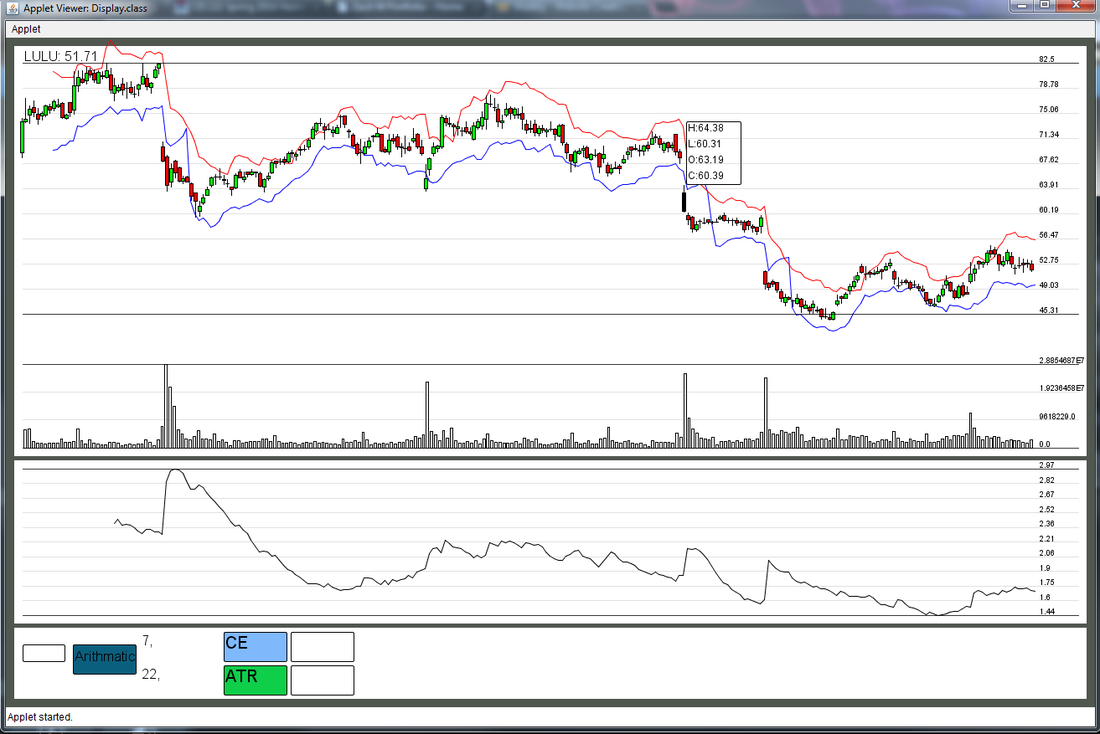
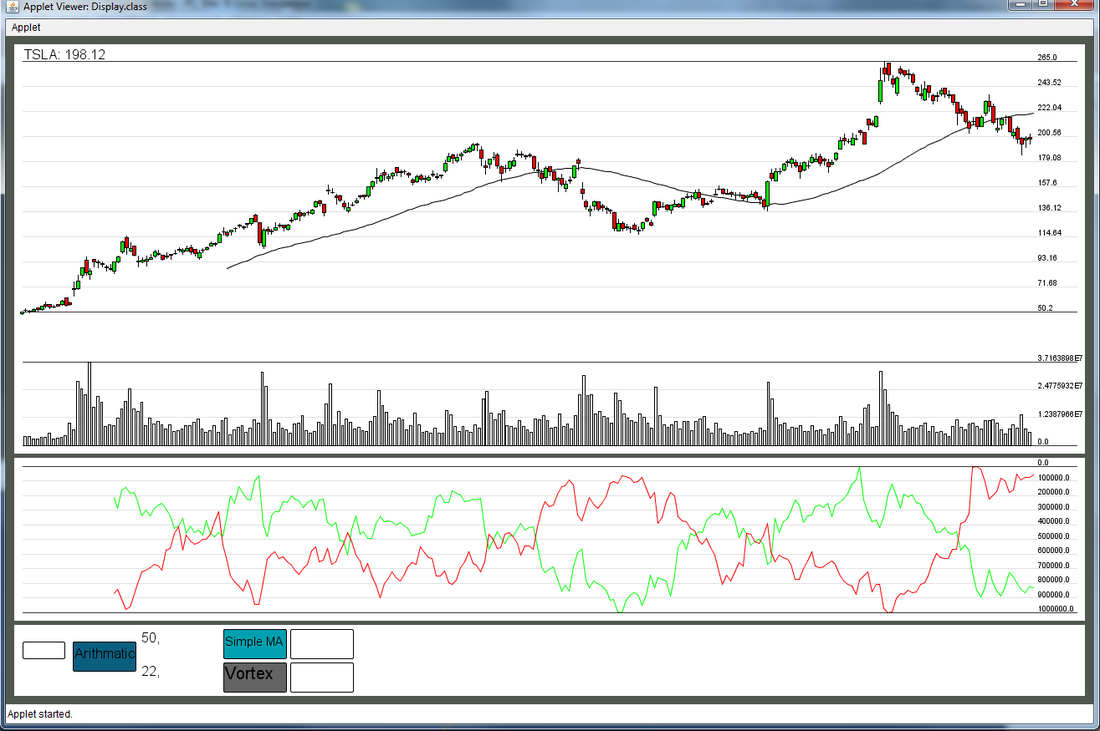
This program is still a work in progress. Currently it can grab a years worth of data from online for almost any stock and display that data in a candle stick graph. It also graphs the volume and displays that in the histogram. Both graphs can be seen above. In the images below you can see that the program has input text boxes for new stocks and values for the indicators currently in the system.
It is written in Java and Processing
It is written in Java and Processing
|
|
